

Usage and limits
5 min read
Use this section to understand and control what your agents consume, beyond billing.
Statistics
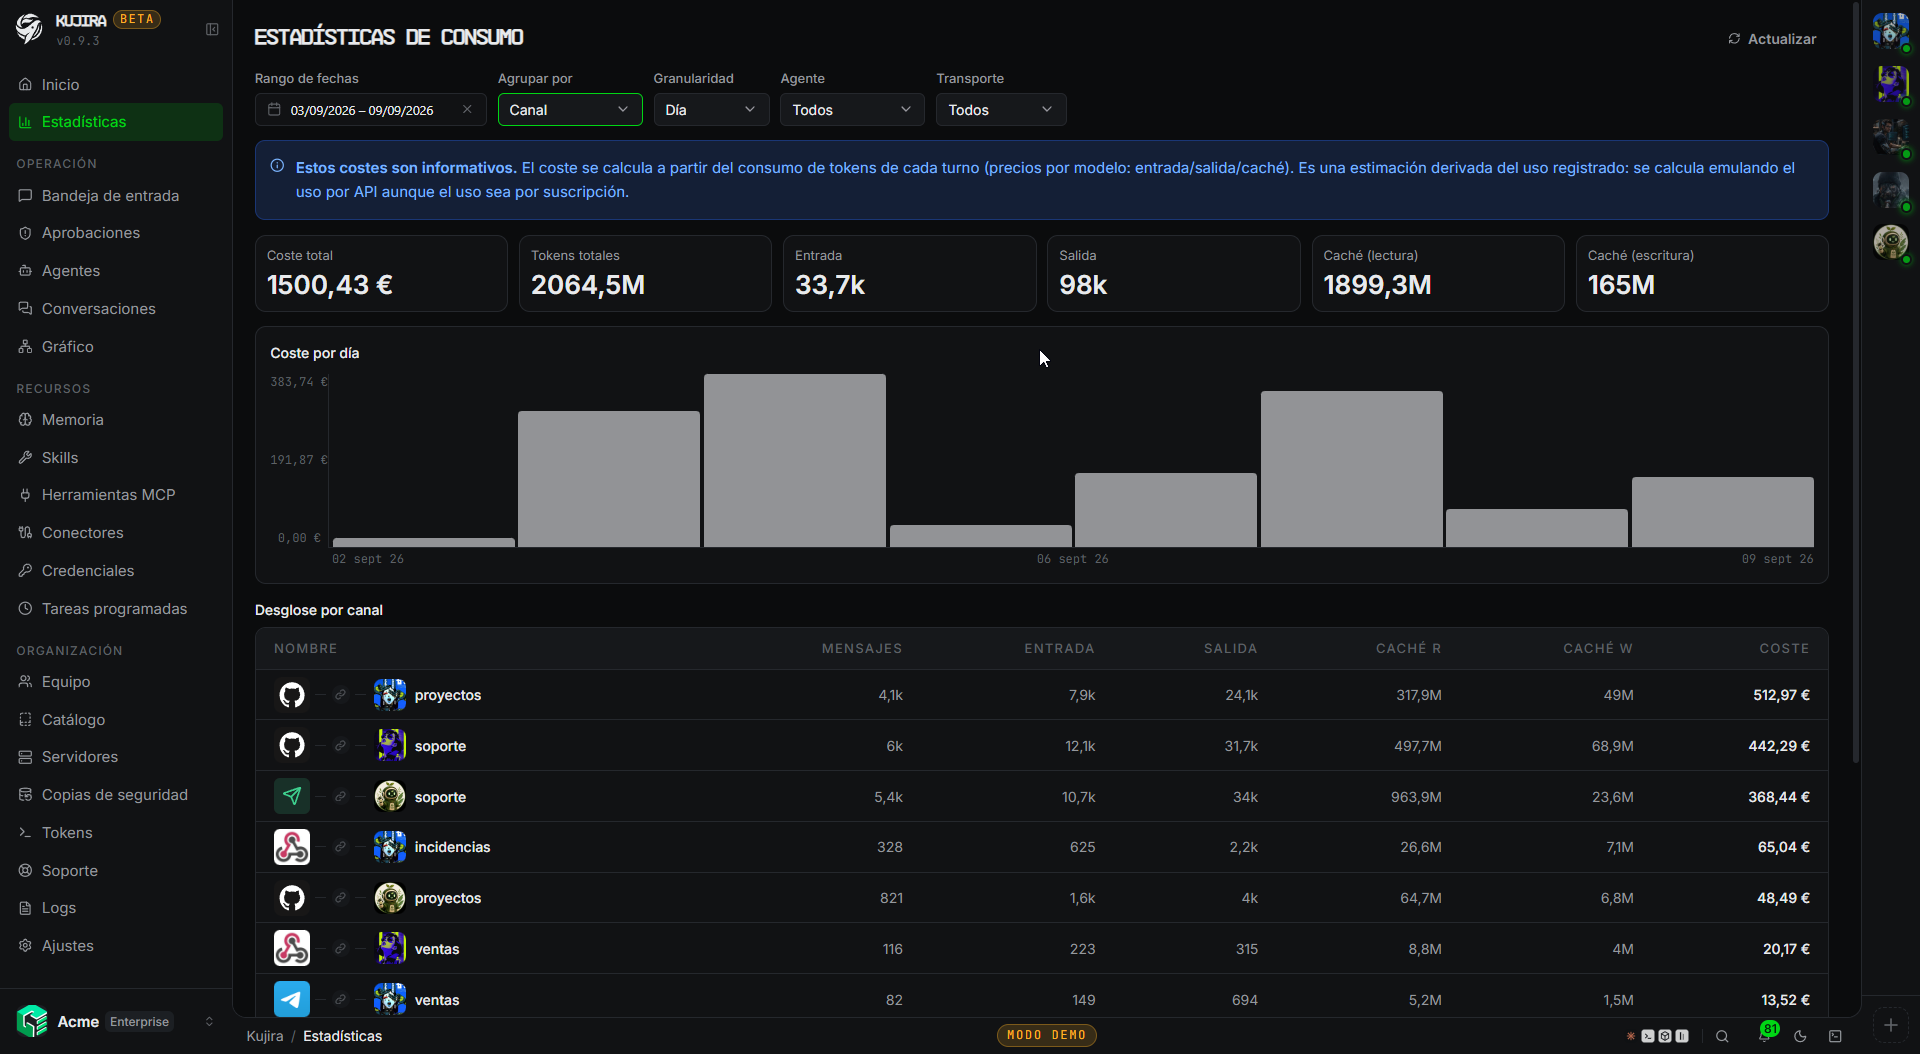
In Statistics, you see usage recorded for every model response. The top selector combines a date range, agent or transport filter, chart granularity, and grouping criterion. The chart shows changes over time and the table explains the total.
How cost is calculated
Each turn stores the tokens reported by its model and Kujira applies that model's rate per million tokens. If several models were used in a period, every turn is calculated with its own rate before they are added.
The calculation at a glance
Tokens used → model rate → estimated cost
Kujira counts input, output, and cache separately for every turn, values each with the applicable rate, and adds all turns in the selected period.
| Data | What it represents |
|---|---|
| Input | New tokens sent to the model: your message, instructions, and context that was not reused. |
| Output | Tokens generated by the model while responding or performing a task. |
| Cache read | Context reused by the provider from cache, usually at a much lower rate than processing it again. |
| Cache write | Context prepared for later reuse. Some providers distinguish cache duration and Kujira applies the reported rate. |
If output is high, make replies more focused
Under the agent's Configuration > Behaviour, choose less Detail, a Scannable format, and One message. This can reduce output tokens but does not remove the reasoning or context cost needed for the work.
Total tokens adds all four categories. Local models such as Ollama also record tokens to compare load and context, but their estimated cost is zero because you run the infrastructure.
Costs are informational
Costs are calculated from turn tokens and configured model rates. With subscriptions, this figure is not what your provider charges: it is an API-equivalent estimate. Use it to compare usage and detect trends, not reconcile an invoice exactly.
Group and narrow analysis
Choose a period first, then the dimension that answers your question: Agent, Channel, Transport, Scope, Conversation, Contact, Model, or Scheduled task. Agent and Transport filters reduce the data before grouping.
Granularity changes chart detail, not totals: use Hour for a recent spike, Day for routine tracking, Week for several months, and Month for a yearly view.
A practical way to investigate an increase
Start grouped by Agent. Filter the agent that grew, then try Channel, Conversation, and Model. The table shows whether the cause is more messages, longer replies, cache context, or a higher-rate model.
Maximum usage rate
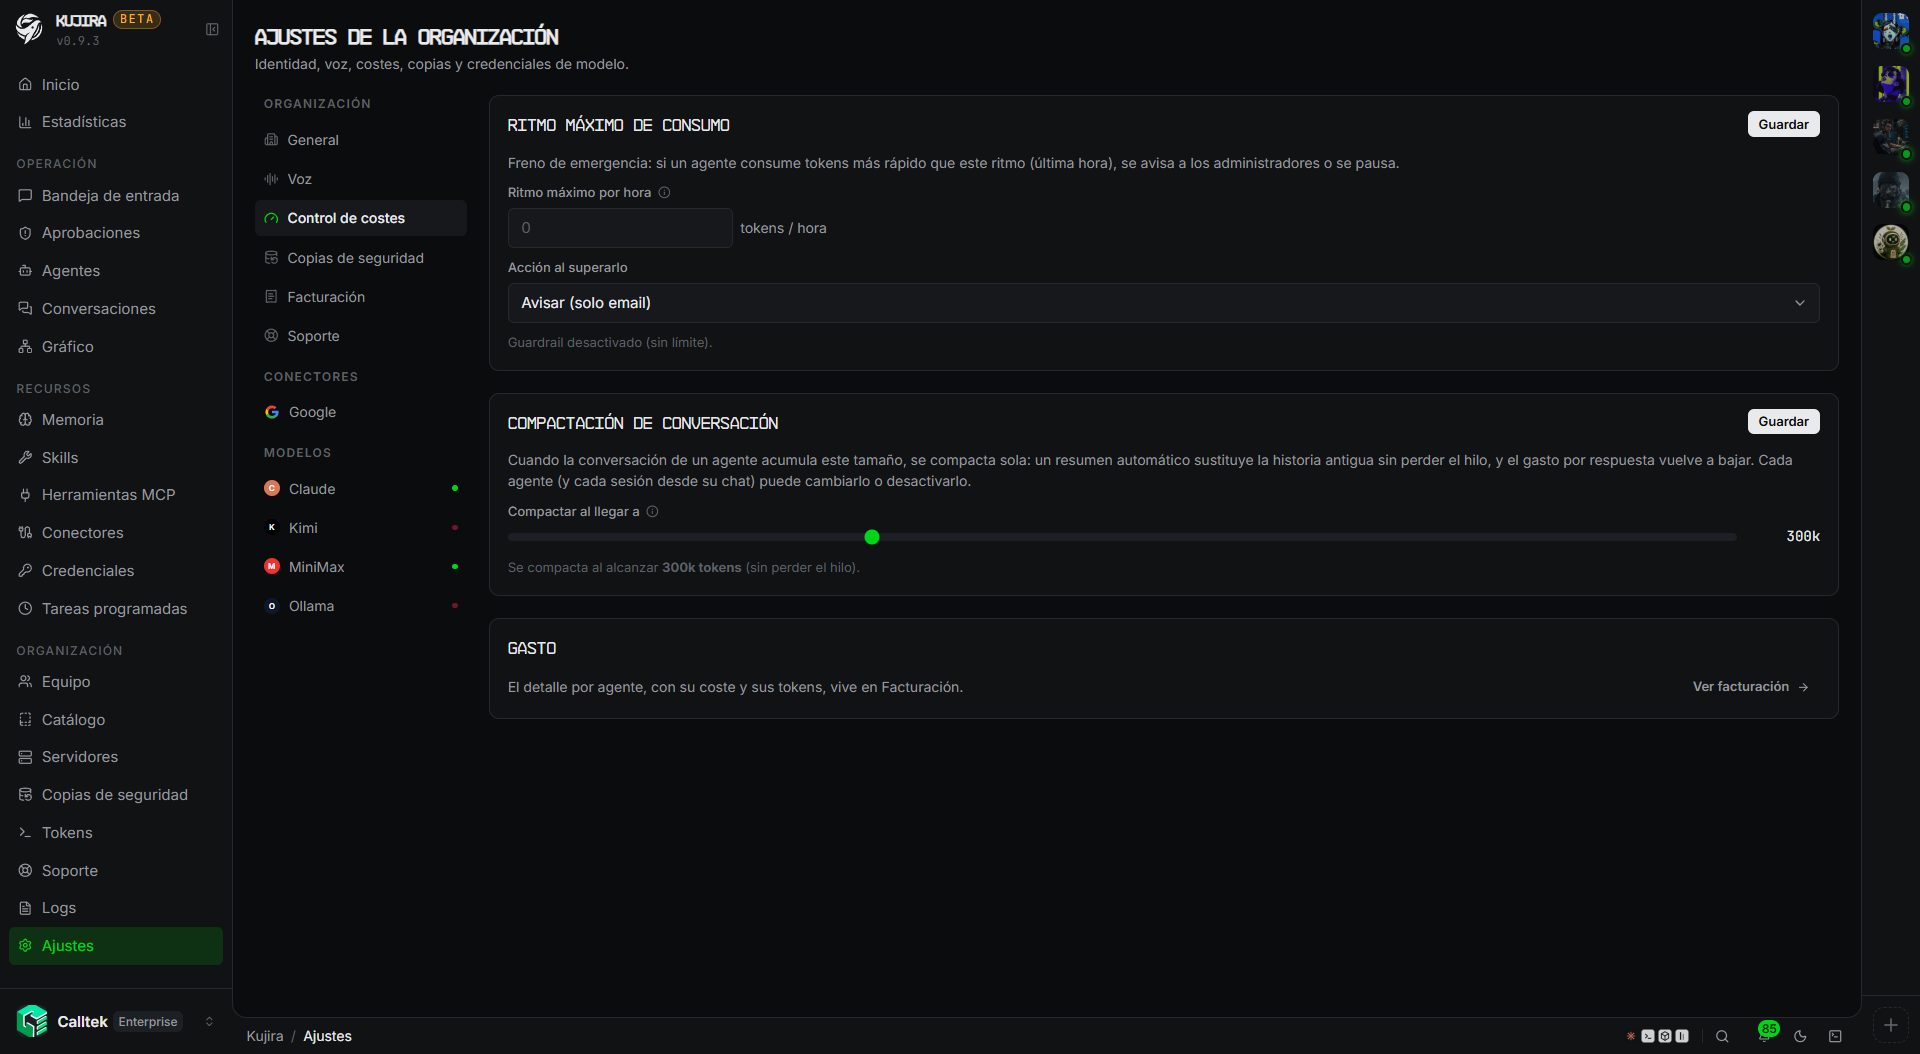
This is the emergency brake. If an agent consumes tokens faster than your set rate over the last hour, Kujira alerts administrators or pauses the agent, depending on your choice.
Set it by default in Settings › Cost control; every agent can inherit it, disable it, or use its own value. If you configure nothing, your plan's limit applies, and it still applies when you switch an agent's brake off: you can raise or lower it, not remove it. The maximum depends on the plan.
The email about an agent going over its rate arrives once a day per agent and action, even if it stays over for hours. The bell in the panel keeps warning every hour.
Conversation compaction
When a conversation accumulates context, every reply costs more. At the threshold, the conversation compacts automatically: a summary replaces older material without losing the thread, reducing cost per reply again.
A new organization brings nothing forward: each conversation uses its model's full context window and compacts when it fills up. Compacting earlier saves money, but it costs a full turn and loses detail, so the timing is each organization's call.
If yours predates September 2026, it keeps the figure it already had as its cap — 300,000 tokens unless you changed it — so nothing moved overnight. To use the full window, clear that cap.
Settings › Cost control has two settings, and whichever comes first applies:
- Share of the window. It means the same across the organization even when agents run different models: 30% is about 300,000 tokens on a 1M model and about 60,000 on a 200k one. At 100% nothing is brought forward.
- Token cap, optional. Compacts at that figure even when the share would come later. This is the one to set to contain spend on very large windows.
Each agent can inherit that setting, never compact, or set its own threshold in tokens, and each session can do the same from the chat.
A threshold doesn't apply in two cases. If it reaches the model's window it brings nothing forward, since the conversation already compacts when it fills up. And if it falls below 20,000 tokens, the summary would replace what the agent loads at boot.
Two cases worth adjusting
MiniMax M3 on pay-as-you-go doubles its rates above 512,000 input tokens. With long conversations on that model, set the cap at 500,000.
Ollama keeps no context cache: it re-reads the whole conversation every turn, so replies slow down as it grows. Lowering the share fixes it.
In Statistics, group by agent and review the chart first when usage grows unexpectedly.