

The dashboard
2 min read
The Home page gives you a quick view of the organization: recent activity, server status, and that day's usage. While it is still pending, it also shows the initial setup guide.
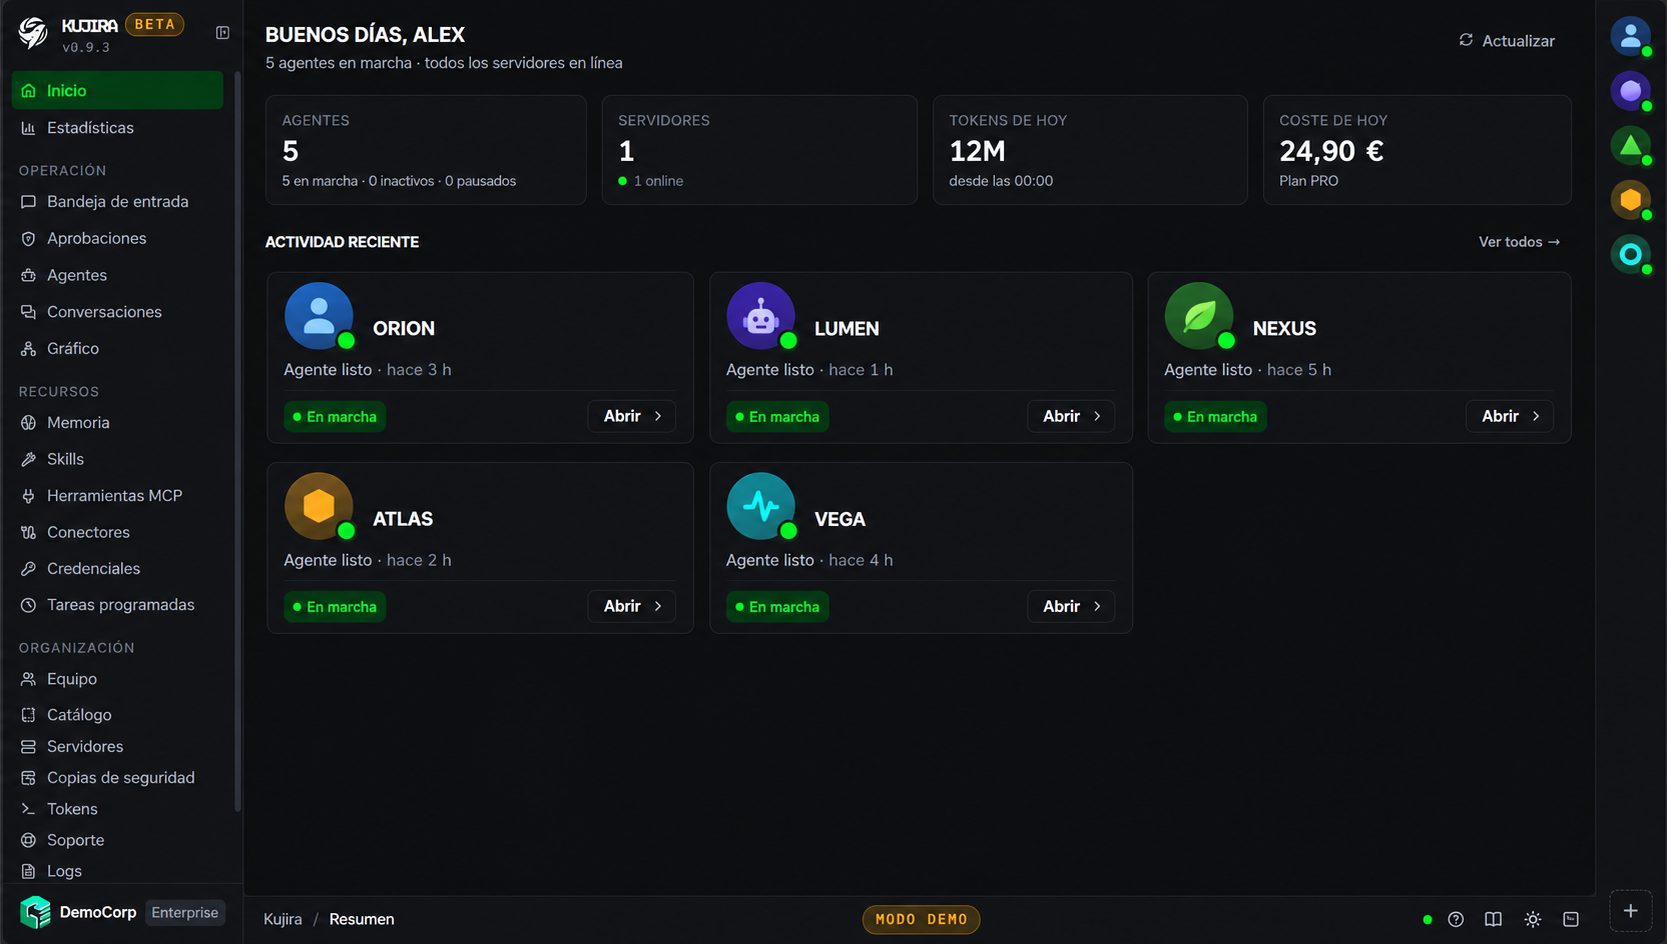
The dashboard has three navigation areas:
Sidebar
Access the organization's work areas and your account settings.
Toolbar
Search for information, view notifications, and adjust the dashboard appearance.
Agent access
Open a conversation with the agents you can access.
Sidebar
The menu groups sections by task. The options you see depend on your role and permissions: servers, backups, tokens, and records are only available to authorized profiles; organization settings belong to the owner.
If a specific section is missing, check your team permissions.
At the bottom, you will find the organization selector and the account menu. The top button collapses the menu to icons only.
Toolbar
On desktop, the toolbar is at the bottom. On mobile, it moves to the top, next to the sidebar control.
Search
Open search with Ctrl + K or ⌘ + K. It can find agents, conversations, skills, memories, credentials, and scheduled tasks. Results respect your permissions.
Notifications
Collects notifications from agents and servers, such as pending approvals, offline agents, or failed backups. Each notification includes a direct link.
Theme
Switch between light and dark modes according to your preference.
Quick access to agents
The right column gives you direct access to the agents you can interact with. Select one to open its conversation.
The indicator next to the avatar shows the agent's status.
On mobile, the agent column opens from the right edge and the sidebar from the left.
Theme and interface density
In My account › Profile, you can set the theme and interface density. This preference is stored per device, so you can use different settings on each computer.
On mobile devices
The dashboard can be installed as a web app. In the browser, choose “Add to Home Screen” to open it as a standalone app without the address bar.